
If your LinkedIn marketing strategy is developed, you’re posting consistently on your Company Page, and you’re engaging with your connections, there is just one thing left to do—track and evaluate your LinkedIn Company Page performance.
Here, we dive into setting goals for your LinkedIn Company Page and how to tie metrics to those goals. We’ve outlined six of the most important metrics to track and how to do so.
Since 2021, we’ve managed LinkedIn Company Pages for 5 clients, plus our own 2 Pages. We show examples below of charts we use month after month when presenting performance results to our clients.
We’ll also share some average metrics based on the performance of the five Company Pages we’ve managed, along with key benchmarks.
Set Goals For Your LinkedIn Company Page
Goal 1: Maximize Reach on LinkedIn
Metric To Track: Impressions
We think the most important goal is to get your Company Page’s content in front of the maximum amount of people. Since our goal is all about reach, the primary metric we look at to measure that performance is Impressions.
Impressions are counted every time a post shows up in someone’s feed.
Look for a steady increase in Impressions over time. Spikes in Impressions typically happen during months where you might have a big product launch or tradeshow. Aside from the occasional spike or dip, look for a steady amount of Impressions month over month, hopefully with a slight trend upwards.

Example of Impressions over time from LinkedIn’s Analytics
Goal #2: Increase Impressions Through Engagement
Metric To Track: Engagement
If Impressions are your primary goal, how do you go about driving Impressions? Impressions are primarily driven by engagement.
Engagement is simply when people engage with your content by liking, commenting, sharing, clicking, reposting, etc. on your post.

Example of Engagement Rate over time from LinkedIn’s Analytics
If you have a lot of followers, it’s more likely that you’ll get more engagement. But, even with a very small amount of followers, you can still see significant reach and a high number of Impressions with an engagement strategy.
Goal #3: Drive Traffic & Conversions To Your Website
Metric To Track: Website Traffic & Goal Completions
Most likely, you will want to include external links to your blog or website in some of your posts on LinkedIn. LinkedIn doesn’t favor these external links because it takes people away from their platform.
However, a main objective should be to use LinkedIn as a tool to drive traffic to your own website or marketing funnel. Simply know that you won’t get as much reach on your post if an external link is included. We recommend limiting linking to your own website to less than 20% of your posts.
This metric can be tracked in Google Analytics, so be sure you’re tracking events and goals in GA4. Essentially, you’ll want to see how many people come to your website as a result of your LinkedIn marketing efforts.
This is very easy to see in GA4 by searching for “linkedin” when viewing the Traffic acquisition: Session source/medium report. In this view, you can see how many users, sessions, events, and conversions took place from traffic from LinkedIn.

It may also be of interest to you to see the top viewed pages on your website from LinkedIn. Typically, this will be skewed based on pages you’ve linked directly to in your posts, but sometimes you’ll see top other pages people navigate to.

For example, in the list above, our blog posts were directly linked to from LinkedIn posts, thus they received the most views. However, the other pages viewed were not directly linked in that month.
We find careers pages to be particularly popular, which makes sense given a key audience objective on LinkedIn is searching for jobs.
Goal #4: Increase Page Views on LinkedIn
Metric To Track: Visitor Metrics
Let’s head back to LinkedIn’s own Analytics. Visitor analytics include Page views, unique visitors, and custom button clicks.
If you’ve implement a solid content strategy on the platform and are using relevant and high-search hashtags, you should see a steady amount of Page views and unique visitors on your page.

We don’t suggest looking for much growth here, but simply reference a month-to-month view to ensure no significant dips occur that can’t be explained due to seasonality or other business-specific factors.
Goal #5: Get More Followers on LinkedIn
Metric To Track: Follower Metrics
Oftentimes on social media, Page owners are most interested in high follower counts. In reality, follower count is mostly a vanity metric when it comes to LinkedIn Company Pages.
Many Pages have purchased low-quality followers that have no effect whatsoever on the performance of their posts. A high follower count is only impressive in enticing non-followers to join the large group and follow your Page as well. Essentially, follower count provides social proof that your Page is worth following.
While it is true the more followers you have, the more people will potentially see your posts and engage, you want to build a real, engaged following to achieve the primary goals outlined above.
Aim to slowly but surely grow the followers on your LinkedIn Company Page. If you’re posting high-quality, relevant content, using a hashtag strategy, and implementing technical strategies (posting at certain days, times of day, tagging/not tagging other people and Pages), the followers will come!

Example of Follower growth in the last 1 year
Based on what we’ve seen, you can expect your follower count to increase by 50-100% each year.
Goal #6: See How Your Performance Compares To Others
Metric To Track: Competitor Comparison
LinkedIn’s Competitor Analytics includes the ability to track 9 competitors and compare your total followers and new followers to their Pages, as well as your total engagements and total posts compared to your competitors.
Don’t expect much movement from month to month in follower count rankings. This is because generally all Pages are increasing their followers at the same time. We see rank increases only very rarely on the Pages we manage.
The main thing to evaluate is total engagement numbers compared to those of your competitors. Understanding your competitors’ follower counts is somewhat important in this analysis.
For example, if a competitor’s Page has 10,000 followers compared to your 1,000, the competitor will most likely have more total engagements. But even with this huge follower difference, you can still come close to and sometimes even outperform these larger competitors with your total engagement numbers.
Here’s an example where the Page we managed for our client Starwest Botanicals consistently outperformed their competitors despite their competitors’ massive follower numbers.
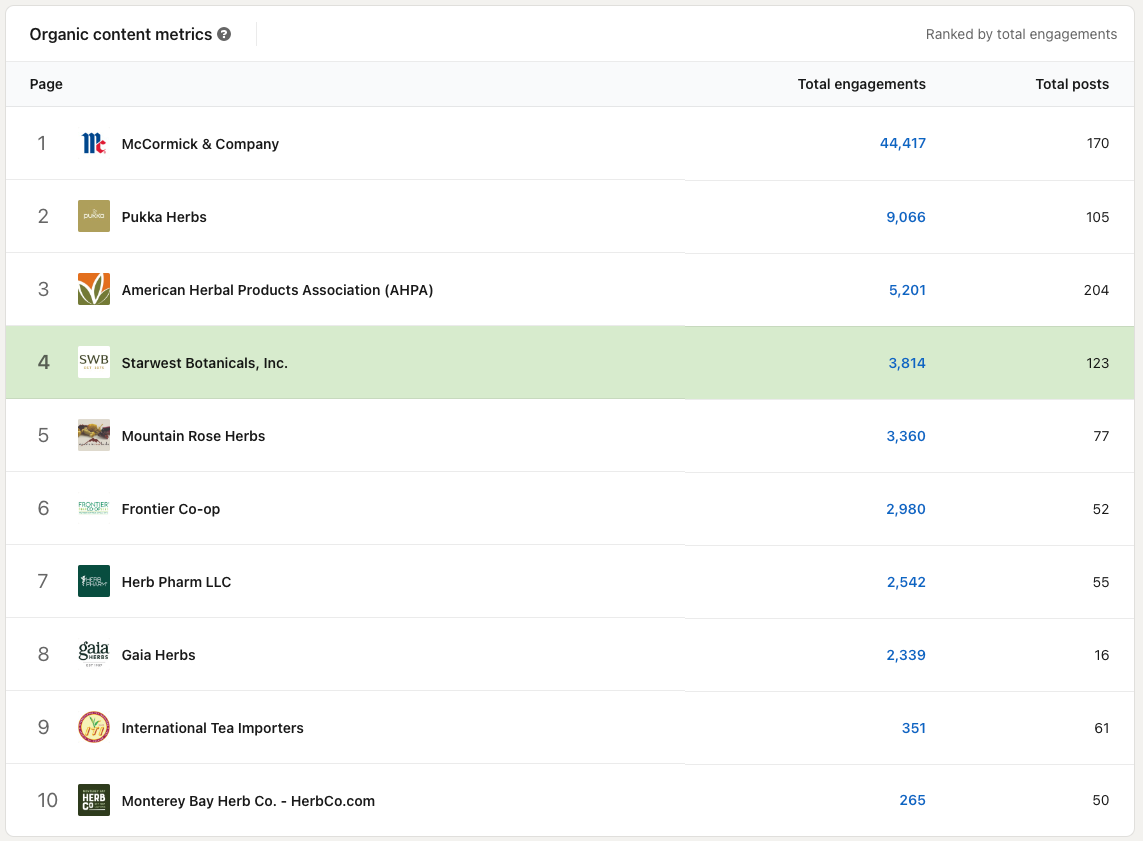
Total engagements and posts during 1 year: Our Page ranked 4th, outperforming 4 Pages with 2x-3x the followers.
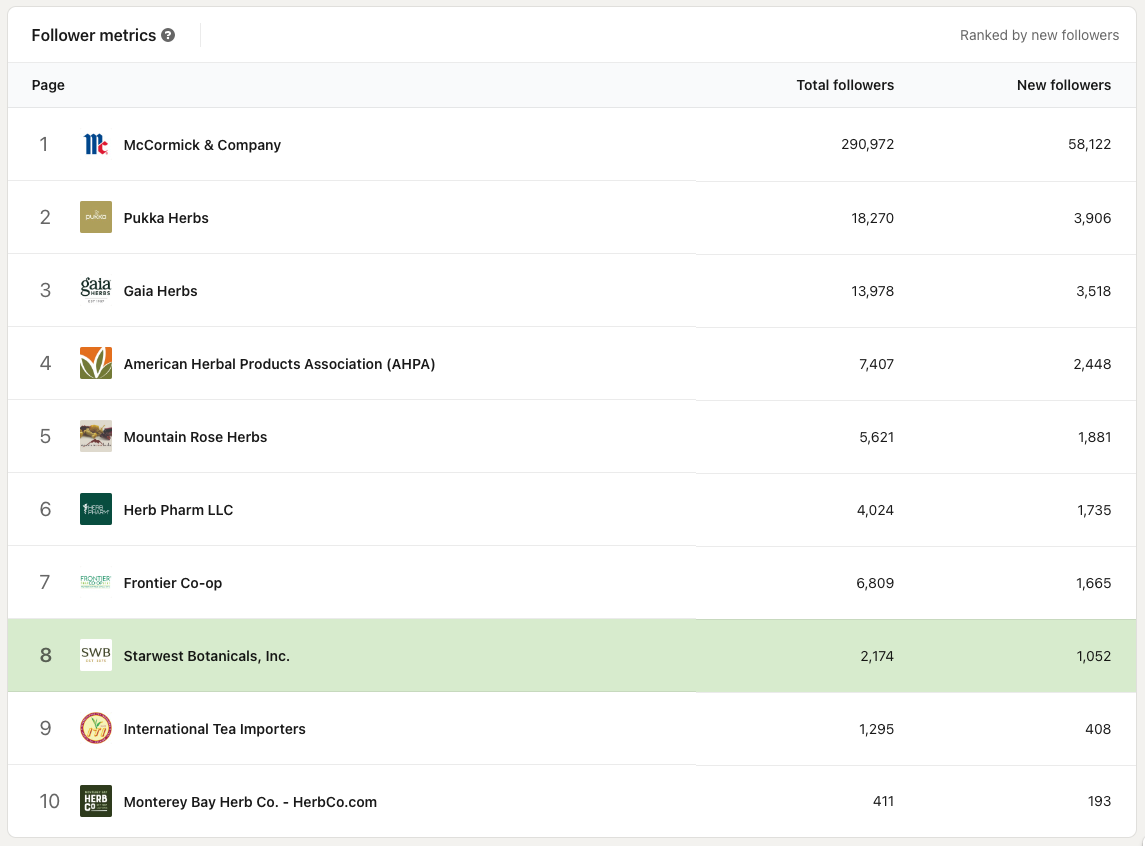
Total followers ranked by new followers during 1 year: Our Page ranked 8th
Metric To Track: Benchmark Comparisons
As a Certified Databox Benchmarks Partner, we host a free Benchmark Group that calculates the median, top quartile, and bottom quartile B2B LinkedIn Company Page performance. Members can join anonymously and see how their performance compares to the group. The group is made up of around 1,000 other companies whose LinkedIn Company Pages’ median number of followers is 1,930.


Is your LinkedIn Company Page performing well, or is there room for improvement? Are your Impressions higher than others? Are you getting an average amount of Comments and Reactions? We’ll help you answer these and other questions during a free benchmark consultation.
Conclusion
All you need to get started in tracking your performance on LinkedIn is the Analytics dashboard that is accessible through your Company Page management interface. You can also add in Google Analytics if website traffic from LinkedIn is a goal of yours. And, you can join our Benchmarks Group to get even further insights into how your Page is performing month-to-month compared to other similar companies.
We recommend creating a monthly or quarterly report with the above metrics and charts to track your progress!