

Since 2021, we’ve managed 5 LinkedIn Company Pages for B2B businesses, plus our own two Company Pages. Here, we outline benchmarks for LinkedIn Company Pages.
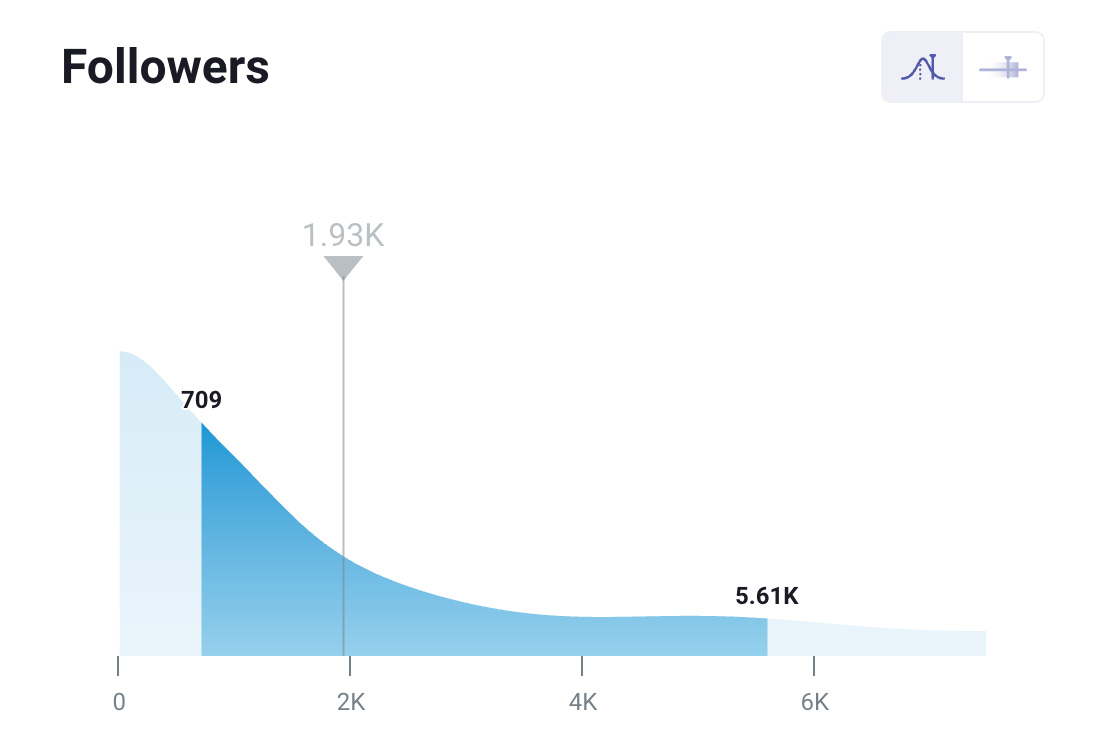
We recently created a Databox Benchmark Group “B2B LinkedIn Company Page Benchmarks” to measure our clients’ performance against roughly 1,000 other B2B LinkedIn Company Pages. When you’re comparing your Page to others, you’ll want to be sure you’re comparing your Page with Pages that have similar amounts of Followers. The median value in my Benchmark Group is 1,930 Followers.
Our strategic approach to LinkedIn Marketing is based on maximizing reach through engagement. Maximizing reach—getting your posts in front of the maximum number of people—is our primary goal for our LinkedIn marketing work. Reach is measured by Impressions on LinkedIn.
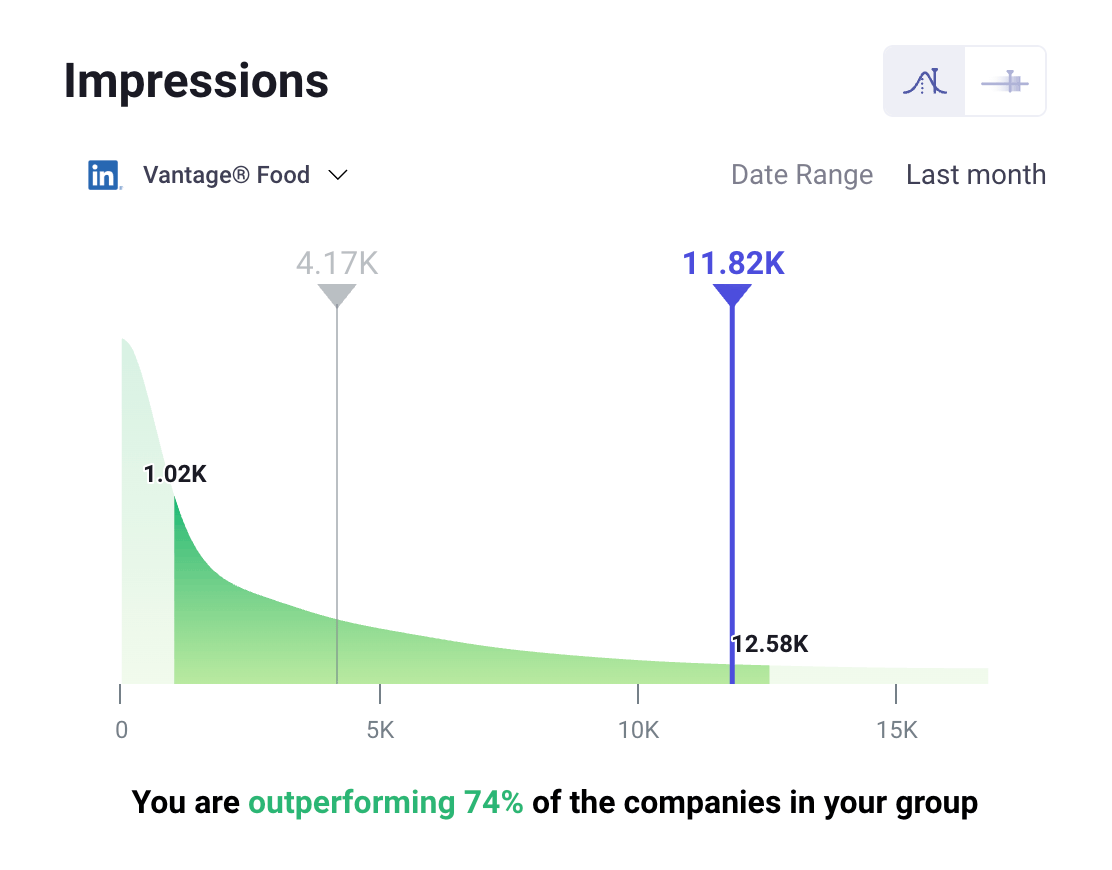
Impressions Benchmarks for LinkedIn Company Pages
Organic Impressions are the number of times your unsponsored/unpaid posts show to LinkedIn members during a specified date range. In the data we show below, that’s 1 month (data from October 2023).
So what is a good number of Impressions on LinkedIn?
Our Databox Benchmark Group shows the average number of Impressions for LinkedIn Company Pages is 4,170 Impressions per month.
For our clients (with follower counts between 2,000–4,000), we typically earn between 4,000–12,000 organic Impressions* per month.
But how do we drive Impressions? Impressions are primarily an outcome of good engagement. Engagement is when people engage with content by liking, commenting, sharing, clicking, reposting, etc. on a post.
Engagement Rate Benchmark for LinkedIn Company Pages
Engagement rate is calculated as: (Clicks + Reactions + Comments + Shares + Follows) / Impressions.
What is a good Engagement Rate on LinkedIn?
Databox’s Benchmark Groups doesn’t have a metric for Engagement Rate (yet!), so we’ll show you the results we’ve seen with our clients here.
Our data shows that an average Engagement rate on LinkedIn Company Pages is 10.7%.
These charts show our Page’s Engagement Rates from Dec. 2022–Oct. 2023.
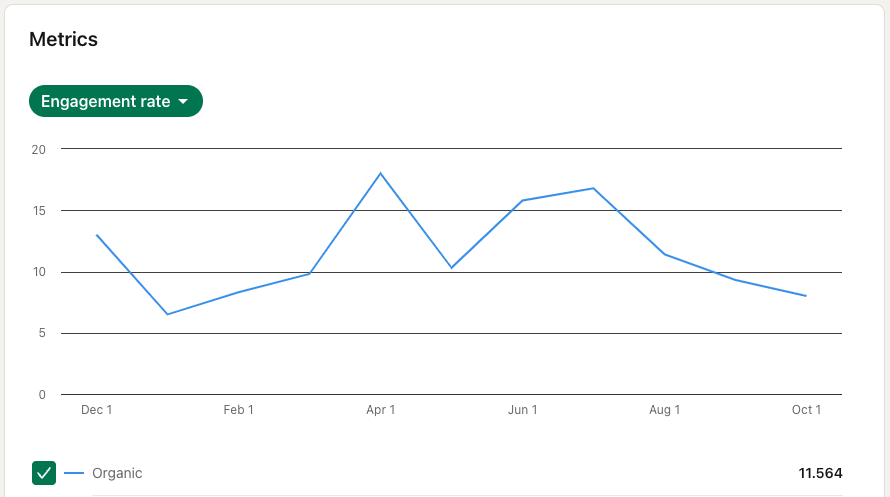
There are seasonal fluctuations that we notice for all metrics and all Pages, with the best performance occurring in the summer months.
Comments Benchmark for LinkedIn Company Pages
How many Comments do LinkedIn posts get on average?
Our Databox Benchmark Group shows the average number of Comments for LinkedIn Company Pages is 3 Comments per month.
For our clients (with follower counts between 2,000–4,000) we typically earn between 40-80 Comments per month (3-5 per post on average).
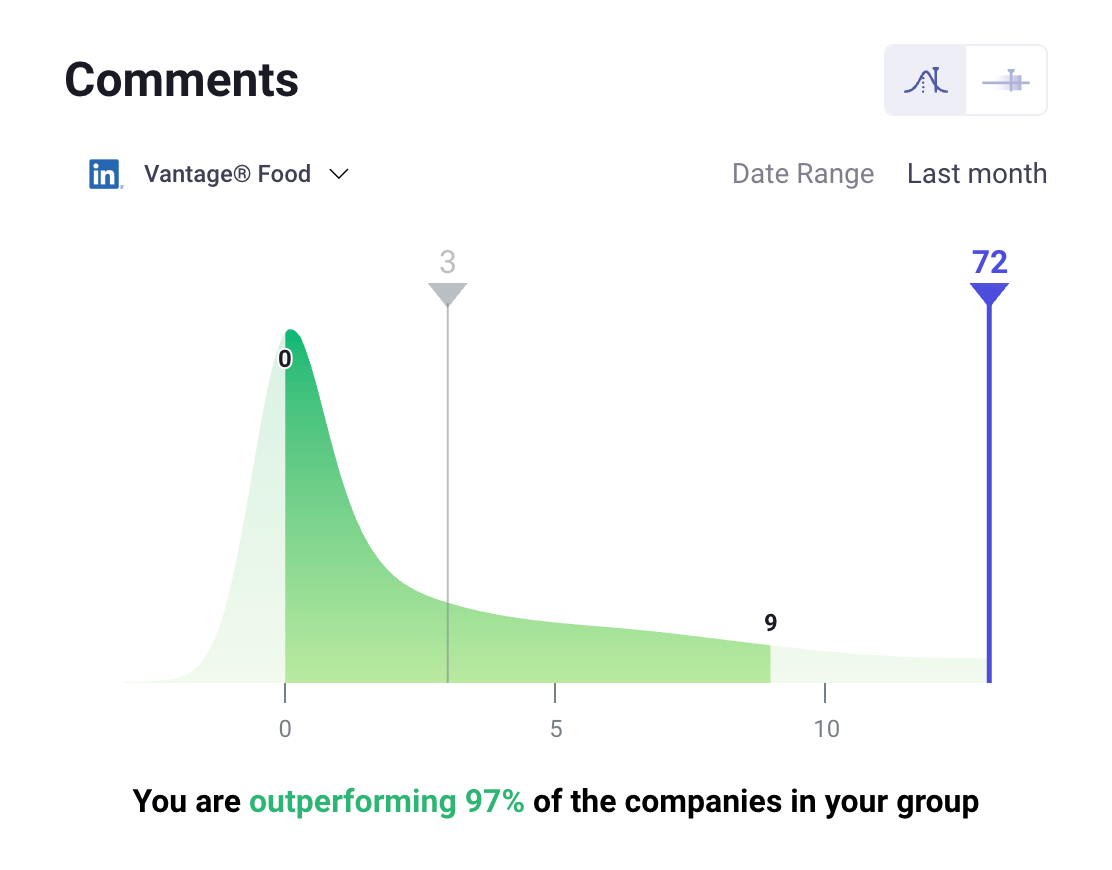
So how do we typically earn more than 3 comments per post and outperform up to 98% of other B2B Company Pages on LinkedIn?
Our strategy combines a deep understanding of the algorithm with directed engagement centered around comments. High engagement drives high Impressions and ultimately, qualified leads, for our clients.
Check out our free e-book all about LinkedIn Marketing for more information on strategic engagement and commenting!
Other than comments, Clicks, Reactions, Shares, and more, all play into your Engagement Rate.
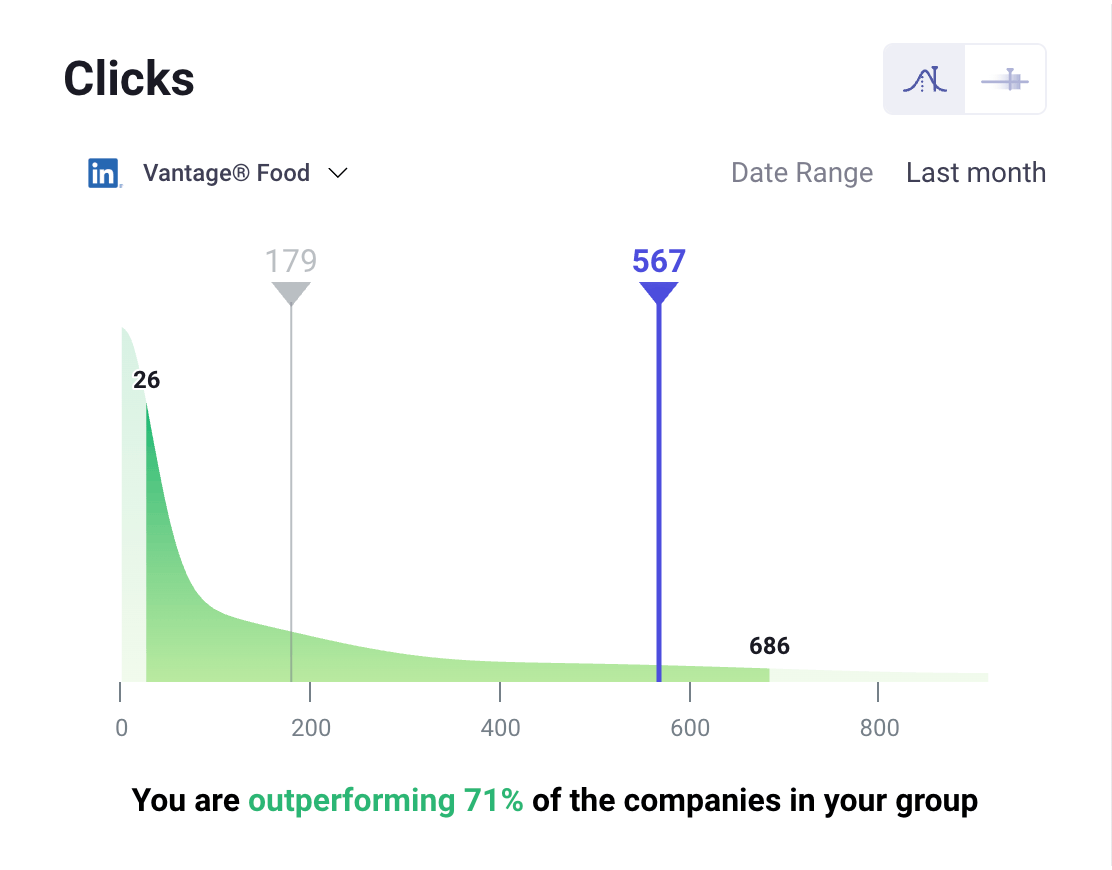
Clicks Benchmarks for LinkedIn Company Pages
Clicks are defined as the “Number of New Organic Clicks on the Content, the Company Name, or the Company Logo during the specified Date Range.”
Our Databox Benchmark Group shows the average number of Clicks for LinkedIn Company Pages is 179 Clicks per month.
We typically earn between 200–600 Clicks per month (10–40 per post)..
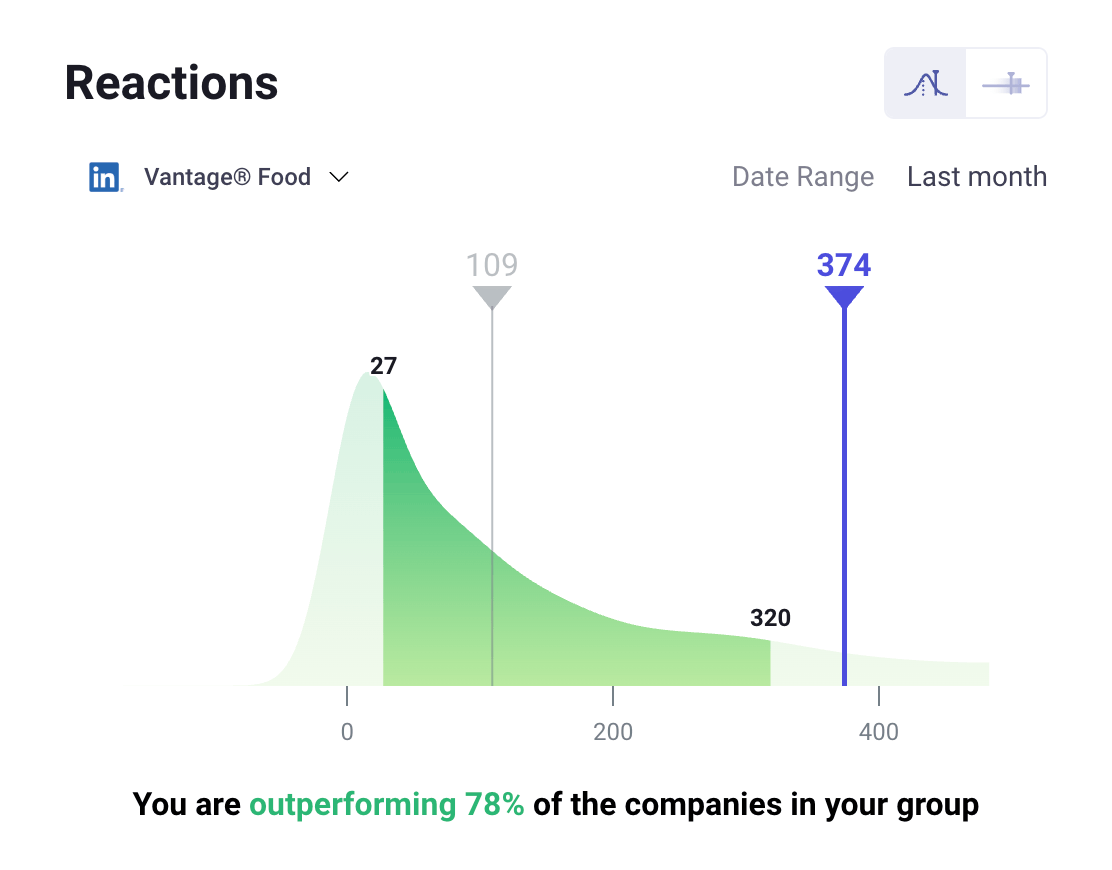
Reactions Benchmarks for LinkedIn Company Pages
Reactions are defined as the “Number of times people have Organic Liked, Commented on, or Shared each Update during the specified Date Range.”
Our Databox Benchmark Group shows the average number of Reactions for LinkedIn Company Pages is 109 Reactions per month.
We typically earn between 100–400 Reactions per month (10–20 per post).
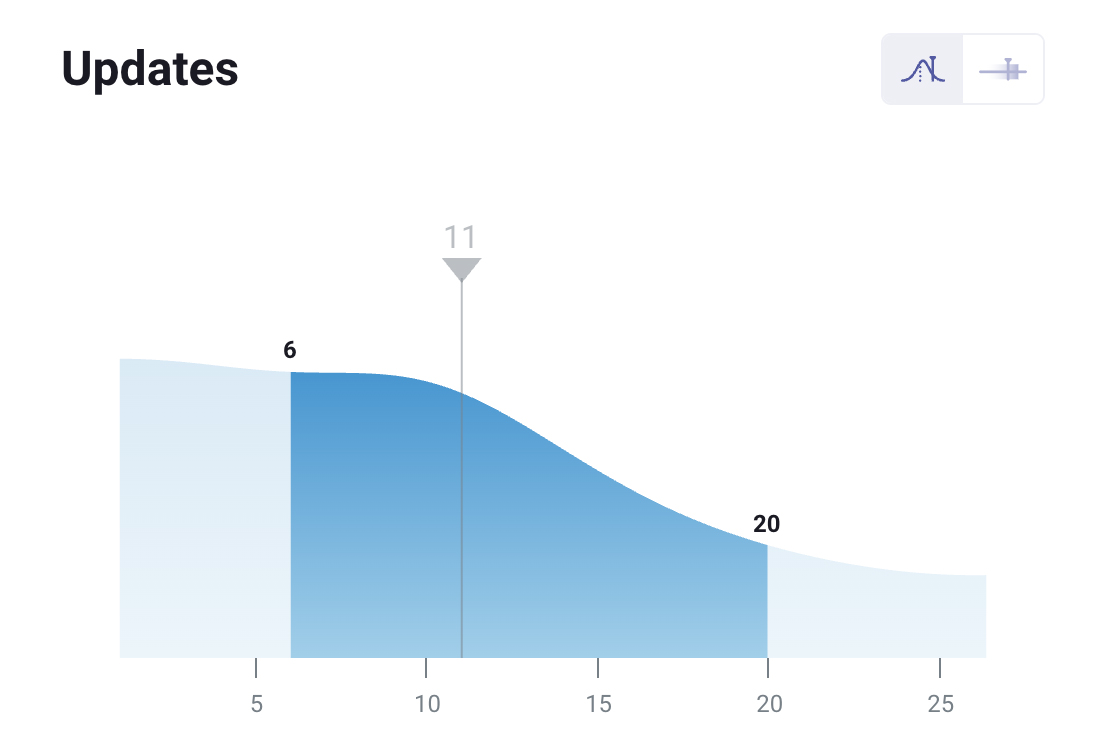
How many posts do LinkedIn Company Pages make on average?
Other than performance benchmarks, you might be interested to know how often LinkedIn Company Pages are posting. Our Benchmark Group has this data as well!
The average number of Updates is 11 per month.
Our free e-book all about LinkedIn Marketing provides more information about how often to post for maximum reach.
Followers Benchmarks for LinkedIn Company Pages
How many followers do LinkedIn Company Pages have on average? We put this one last on purpose because we think it is the least important measure of success on LinkedIn.
Our Benchmark Group shows that out of the roughly 1,000 LinkedIn Company Pages in the group, the median number of Page followers is 1,930.
On social media, your number of followers is largely a vanity metric. While it is true the more followers a Page has, the more people will potentially see its posts and engage, we believe the focus should be on building a community of engaged followers (even if you’re starting out small).
Want to see how your performance on LinkedIn compares to others? Join our free Benchmark Group to see where you’re doing well and how you can improve.