
Google Analytics has been the go-to analytics platform to track website performance for years. But, our beloved Universal Analytics (UA) is set to retire in 2023 leaving us with the widely disdained GA4 in its place.
Out of necessity more than desire, we’re beginning to transition our reporting to GA4.
Each month, we report on the performance of websites and marketing campaigns we manage, and Google Analytics plays a big role in helping us see, analyze, and report on that performance.
There are some really cool features in GA4 that we’ve liked using during the past couple years since we initially set it up in tandem with UA. Since then, we’ve used a hybrid of UA and GA4 data to compile reports for our clients. But with UA supposedly retiring soon, we’re figuring out now how to transition to GA4-only reports.
So what do we need to track? Here are the things we think are most important. We’ll show examples from our own website and sites we manage, and show you where to find the same dashboards in both UA and GA4.
#1. Key Website Metrics To Track
On a high level, we like to track key website metrics including traffic sources, number of sessions, number of users, pages per session, average session duration, and number of goal completions.
In UA, find this chart under Reports > Acquisition > All Traffic > Channels

This gives me a high-level overview of how much website traffic I received, where the users came from, the percentage of new users, the time they spent on the site, and how many goal completions happened.
From here, you can click on each traffic source, or “default channel grouping”, to see more details about each.
This is especially important to see what websites made up the Referral traffic, and what social channels made up the traffic from Social.
In GA4, you’ll need to choose if you want to look at this report in terms of User Acquisition or Traffic Acquisition. Here are the differences:
- User acquisition: the first campaign/source/medium observed for the user (or more accurately, for the browser/cookie)
- Traffic acquisition: the campaign/source/medium of the session (this will be most similar to what you are used to in Universal analytics)
Personally, I like the ability to differentiate between these two. User Acquisition could paint a more accurate picture of what marketing channels are working best to get users to the website in the first place. You may want to use User Acquisition for reporting on longer periods of time and use Traffic Acquisition in monthly reports.
I’m choosing to use the Traffic Acquisition to have a more apples to apples comparison with UA for my monthly reporting below.
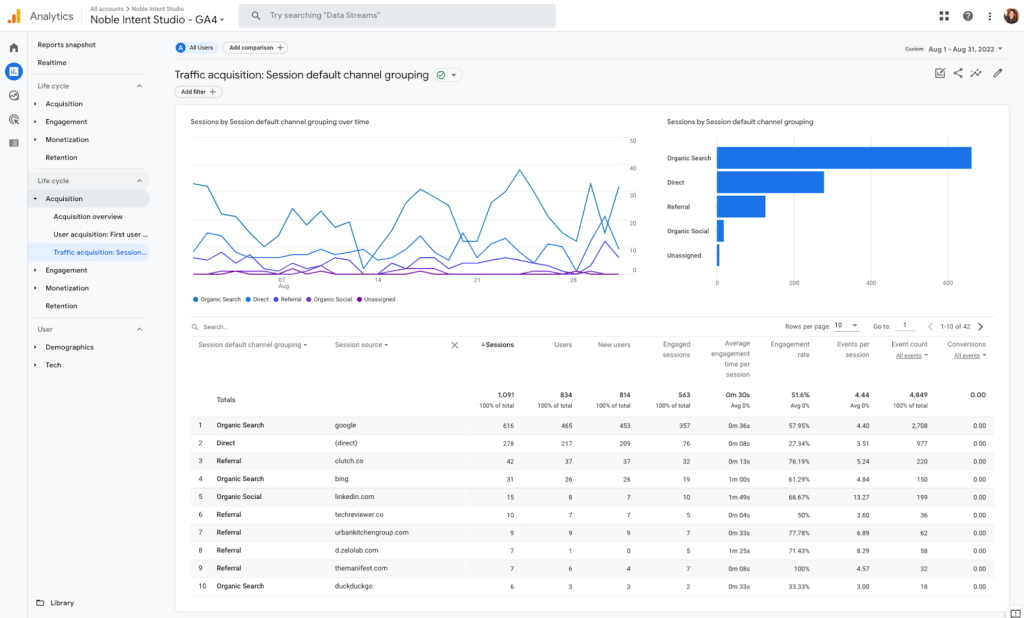
In GA4, find this in Reports > Life Cycle > Acquisitions > Traffic Acquisition

Average session duration becomes average engagement time per session. Bounce rate is omitted and we find engagement rate in its place. You can customize the GA4 report to add some things back in and remove others.
The most frustrating thing I’ve found about GA4 is that you can’t drill into the traffic sources from this view. I would really love to see what those referral sources are by clicking on Referral here!
What you can do is click the blue + icon and add Traffic Source > Session Source here. This starts to show us some interesting high-level data.
Seeing Conversions here will actually be worth the trade off of the drill-in feature I’m used to in UA.
Below, we’ve defined these new and old metrics and suggested benchmarks to measure against for each data point.
Traffic Sources
Traffic sources simply means where visitors (traffic) come from to get to your website. These include, but aren’t limited to: Organic Search (people typing a search term into Google or another search engine), Direct (people going directly to your url), Referral (links to your site from other websites)l, Paid Search (ads), Display (ads), Organic Social (social media that links to your site), Organic Video (YouTube), and Email.
It’s important to see where your traffic comes from to see what of your marketing efforts are working and where there is room for improvement. You probably don’t want all of your website traffic to come from just one source.
According to a report and data from Hubspot, the distribution of website traffic by source is:
- Direct (22%)
- Organic Search (17%)
- Social (16%)
- Email (14%)
- Display ads (12%)
- Referral (9%)
- Paid Search (9%)
- Other (1%)
This traffic mix can vary widely depending on your marketing goals and efforts.
Sessions
A Session, sometimes called a Visit, is a single time that a single user visits your website. During this session, the user may visit multiple pages for a varying amount of time and take varied actions.
Engaged Sessions
An engaged session is defined as a session where the user spent 10 seconds or more on the site, or the user viewed 2 or more page, or had a conversion event.
Users & New Users
A user is simply a visitor to your website. They might be a new user or a returning user (as far as Google can track using their cookies).
Average Engagement Time Per Session
Average engagement time per session has replaced the old Average Session Duration from UA. Average session duration measured the duration of a user’s entire visit. Average engagement time per session measures the “User Engagement Duration Per Session”, which is the length of time that your web page was in focus. This can help you understand when users actively use your website vs. just have the page up but not displayed.
Engagement Rate
Google Analytics has done away with the hotly debated bounce rate metric in GA4. In its place, we now have Engagement Rate. It is calculated by dividing the number of engaged sessions by the total number of sessions.
Many agree it’s a more important metric. It provides valuable information about how often visitors stay on and interact with your website rather than just showing how often they leave.
Events Per Session
GA4 automatically tracks the following Events:
- Click
- First Visit
- Page View
- Scroll
- Session Start
You can find, edit, and add Events in GA4 by going to Configure > Events

Cris will be creating a resources soon about how to add custom Events and then turn them into Conversions!
Here’s a sneak peek of our testing custom Events and marking them as Conversions:

#2. Track Goal Completions & Conversions
Goal completions, or conversions, could be anything you choose to set up. They could include product sales, lead form submissions, contact form submissions, newsletter signups, button clicks, and more.
The ability to track event goals and conversions in Google Analytics is a must-have feature for most people seeking to understand how their website is performing. Here’s more information on what events, goals, and event goals are in Google Analytics. We’ll be updating that resource soon to show you how to set up conversion tracking in GA4!
In UA, we have 4 Goals set up for our website: contact form submission, email signup, ebook download, and ebook banner click.
Goal Completions By Source
The first dashboard we like to reference shows Goal Completions by Source/Medium.
This is found in UA by going to Reports > Acquisition > All Traffic > Source/Medium

A similar view can be found in GA 4 by going to Reports > Acquisition > Traffic Acquisition and toggling to Session source / medium in the top left dropdown under the graph

You can see here, there are a lot of Events listed, but no Conversions. This is because, by default, GA4 includes events such as click, first visit, page view, scroll, session start, and user engagement. However, we’ve not set up custom Events or Conversions in GA4 yet.
You can customize which columns show up in this view (Users, Sessions, etc.).
Let’s jump to our client’s GA4 property where we do have Conversions set up.
Conversions By First User Source/Medium
Conversions by first user source is one interesting feature found in GA4 that will be important to track.
Find this in GA4 under Reports > Life Cycle > Engagement > Conversions, then click the + icon to add Traffic Source > First User Source/Medium

Here, we can see we had 20 Conversions recorded for the time period we’re viewing. Rather than viewing the session source, we’re viewing the first user source—that is, how the user first arrived at the website.
Conversion Attribution By First Click vs. Last Click
Also unique to GA4, we can see Conversions by both first and last click.
In the example below, we see 20 total Conversions. 8 conversions are from Paid Search, based on the source of the users’ first click. But, we see 1 of those 8 conversions being attributed to Organic Social if we look at the source of users’ last click.
Simply put, 1 converting user came to the site initially via Paid Search, but when they eventually did convert that visit was from Organic Social.

Find this in GA4 under Advertising > Attribution > Model Comparison, then select first click and last click in the dropdowns
Conversion Paths
Similarly, you can view “conversion paths” in GA4 as well to really understand how many touchpoints it took for a user to convert, and what those touch points were.

Find this in GA4 under Advertising > Attribution > Conversion Paths
You can see this same Conversion mentioned above that came in through paid search and ultimately converted after a visit prompted by social (in line 5).
This dashboard could be the most telling analysis of what digital marketing tactics are performing best, and more importantly, how all of them are working together to achieve conversions.
This view is the same as UA’s Attribution Beta feature that we’ve been using for some time.
Here’s a more interesting example from one of our e-commerce client we were working with back in 2021.

This is a great representation of multiple digital marketing tactics working together. 56 of 189 conversions required multiple touch points to result in a sale.
#3. Track Pageviews
Getting a view of pageview numbers and growth over time is a good thing to keep track of. You’ll want to make sure there aren’t any big dips (caused by new 404s?) or spikes (caused by spam bots?). Most marketers expect to see some growth over time as well if content marketing efforts are underway.
Find this view in UA under Reports > Behavior > Site Content > All Pages

We can see here in the graph our pageview numbers are pretty consistent over the past 4 months. We have one outlier blog post raking in one third of our total pageviews. Otherwise, the home page is taking the 2nd spot (typically your home page will be your most viewed page).
A similar view can be accessed in GA4 by going to Reports > Life Cycle > Engagement > Pages and Screens, then toggling to Page path and screen class

One thing I do like about GA4 over UA is that this view includes Events and Conversions. While we don’t have Conversions set up yet, this will be a great metric to track in the future!
The graphs in GA4, however, are not as helpful as the UA graph that shows traffic over time.
Top Viewed Pages By Source
Understanding where your traffic is coming from for your most viewed pages is another important metric to keep track of. Here, we typically look at a view of just one month at a time.
In UA, simply use the same view as above, and select Secondary Dimension > Acquisition > Source Medium.

Now we can see that most of our page views are coming from organic search, direct, and clutch.co and linkedin.com referrals.
In GA4, start with the same view as above, and click the blue + button to the left of the Views column. Select Traffic Source > Session Source/Medium

I find it odd that in GA4 you have to click left and right arrows to view additional lines past 10. Simply scrolling down as in UA is better to see chronologically and is much more intuitive.
#4. Track Paid Search Results
If you’re running Google Ads, you’ll want to be sure to have your Google Analytics account linked to your Ads account.
Since we don’t personally run any paid ads, I’ll use a client’s analytics whose ads we manage.
Goal Completions By Campaign
Find this dashboard in UA under Reports > Acquisition > Google Ads > Campaigns

A similar report can be found in GA4 under Reports > Acquisition > Acquisition Overview
Simply click on the “View Google Ads campaigns” report link


Conclusion
While we’re only transitioning to GA4 out of necessity to track website performance, there are a lot of new features that are helpful. Hopefully the downsides of GA4 will be improved over time. We’re losing some things we’ve become accustomed to, but for the most part we are still able to run similar reports and show similar data.